Calculated Columns vs Measures In DAX
Introduction
Earlier on in my career in working with Analysis Services, one of the things I struggled with was when to create a calculated column versus creating a measure. I have noticed that this is something people new to DAX struggle with whether in Analysis Services or in Power BI.
Calculated Columns and Measures both are created using DAX formulas. So why not just always create either Calculated Columns or Measures to be consistent? Why do we need both?
Before we dive into that, we need to understand a little more about how Power Query , the engine behind Analysis Services and Power BI, works.
A little background
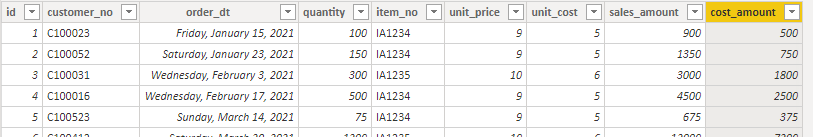
When working with OLAP data sources, the thing to remember is the data is not flat like it is in a database. The data is 3 dimensional like a cube. It is easy to fall in this trap due to when we work with the data, it is shown in tables such as the Sales fact table below.

When looking at an individual table, the data is flat. The depth of the data comes from joining a fact table to dimensions which allow you to drill into that data in the fact table.
For example, if we have a date table that represents order dates, it gives us a unique list of dates. Now if we look at the fact table, the column representing the order date could quite possibly have multiple entries of the same date. This is the reason we create a many to one relationship from the Sales fact to the Order Date dimension.
When creating this relationship, we are adding depth to the cube. The data is not only now able to be summarized based on data on the current table, but we are able to use other tables to summarize data on the Sales fact. This is why tables are flat, but the OLAP cubes are multidimensional. Not to be confused with Multidimensional cubes in Analysis Services. That is a whole different can of worms.
On with the lesson
Now that we understand what is a flat structure and what is multidimensional, let's dive into the purpose of this article. So why do we need both Calculated Columns and Measures?
The easiest way to remember when to use each is Calculated Columns are flat and Measures are Multidimensional. To explain that further, Calculated Columns have the context of a row and a Measure does not. If you then want to do a calculation on a row based on if the order_status column = “Shipped”, then you would need to use a calculated column.
Let’s take a look at our sales data from the table above. I know the price and the unit cost of each item in each row. Let's say that I wanted to calculate the average gross margin for this table. How would we do this?
First, we need to know how to calculate the gross margin. Easy enough. The formula is:
Gross Margin = (Total Revenue – Cost of Goods Sold)/Total Revenue x 100
The first thing we need to do is figure out the Total Revenue and the Cost of Goods Sold. For this article we will refer to them as Sales Amount and Cost Amount accordingly. In order to get the Sales Amount, we need to multiply the quantity by the unit_price. To get the Cost Amount, we need to multiply the quantity by the unit_cost.
Following the formula above, let's try to write a measure for the gross margin.
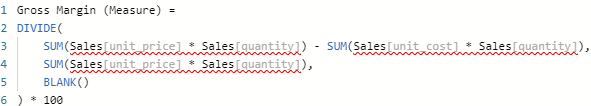
As you can see, Power BI is not happy with our formula. The reason is we are trying to do multiplication in our SUM() which only takes a single column. The easiest way to remedy this is by creating Calculated Columns to represent the Sales Amount and Cost Amount.
We now have Sales Amount:

And we have Cost Amount:

Now our Sales table looks like this:
Revisiting our measure now, let's plug in our new calculated columns and see what happens.
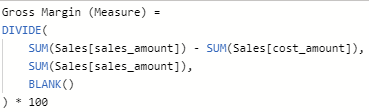
It looks like all of our warnings have disappeared! Now let's take a look at it in a visual so we can do some basic validation.
Checking our totals, (74,179 – 42,395) / 74,179 = .428477…
That looks good. Now let's look at our Gross Margin (Measure) totals and make sure they average out correctly. Wait a minute, the average of the Gross Margin (Measure) column is 43.04333. That does not match our 42.85. What is going on here?
What is happening is when you are using a measure, you are looking at the sums of the sales_amount and cost_amount columns and using those for calculations. Therefore, you are getting the average of the totals, not the averages of the lines. The best way to think about this is if you worked this in Excel, how would you tackle this? You would create a calculated column and then average those summarizations up. This is because when we are looking at this data, we need to look at it line by line and then do an average. Let's create a new calculated column and see what we get.
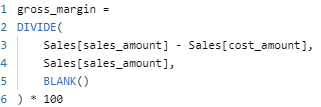
Now that we have created our calculated column, we want to get an average of those values. What we need to do now is create a measure called Gross Margin. We are now creating a measure because it is summarizing over the whole data set and not a line by line basis.

Now let's throw the new calculated column and measure on the visual and see what we get.
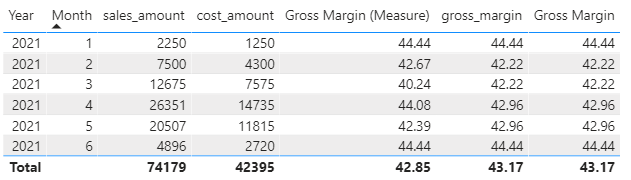
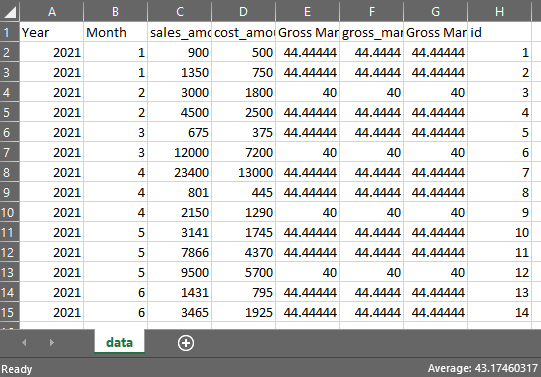
Looking through this you can see that even in a few months, at the line level our old Gross Margin (Measure) was feeding us some bad numbers. Even so, averaging out the numbers on the screen, it still doesn't look right. If we dump the data from our visual to an Excel file and use Excel to check it, you will see that our new Gross Margin is indeed correct.
Summary
Looking back at what we just covered. Again, Calculated Columns are flat and Measures are Multidimensional.
Calculated Columns are used when you are working with data in table where you want to create new data at the row level. Measures are for when you want to create a calculation for data across a data set or multiple tables.
I don't have a comments section yet, so feel free to send me feedback on this blog.

Kevin is a data engineer and is the Business Intelligence Practice Lead at Software Design Partners specializing in data warehousing. He is a father, an occasional gamer, and lover of many different types of music.
The opinions expressed on this site are my own and may not represent my employer's view.
About this blog...
Let us take a look at when we should use calculated columns or measures in DAX.